Table of Contents
- 1. The Core Architecture: SIP vs Lump Sum Defined
- 2. How Rupee Cost Averaging (RCA) Actually Works
- 3. Head-to-Head Simulation: ₹1.2 Lakh in 3 Market Scenarios
- 4. Calculating Yield: Why CAGR Fails for SIP and You Need XIRR
- 5. FY 2026-27 Capital Gains Tax Rules: The 12-Month FIFO Trap
- 6. Investor Psychology: All-Time Highs and Market Timing Fallacies
- 7. Advanced Strategies: The 10% Step-Up SIP and STP Workflows
- 8. 5 Costly Mistakes Indian Mutual Fund Investors Make
- 9. Frequently Asked Questions (FAQ)
- 10. Summary & Decision Framework
1. The Core Architecture: SIP vs Lump Sum Defined
When investing in Indian mutual funds, equities, or exchange-traded funds (ETFs), your entry velocity dictates how your capital interfaces with market volatility. Both methods allocate capital into identical underlying assets, yet their risk profiles, psychological strain, and cash-flow mechanics could not be more divergent.
Lump Sum Investing is the deployment of an entire capital allocation in a single transaction on a single date. For instance, if you receive an annual performance bonus of ₹3,00,000 in April, you purchase mutual fund units immediately at that specific day's Net Asset Value (NAV). Your entire principal begins compounding from Day 1. If the market embarks on an unhindered upward climb, lump sum investing captures maximum gains because 100% of your capital enjoys the entire duration of the rally. Conversely, if the benchmark indices correct 15% the following week, your entire portfolio incurs an immediate paper loss.
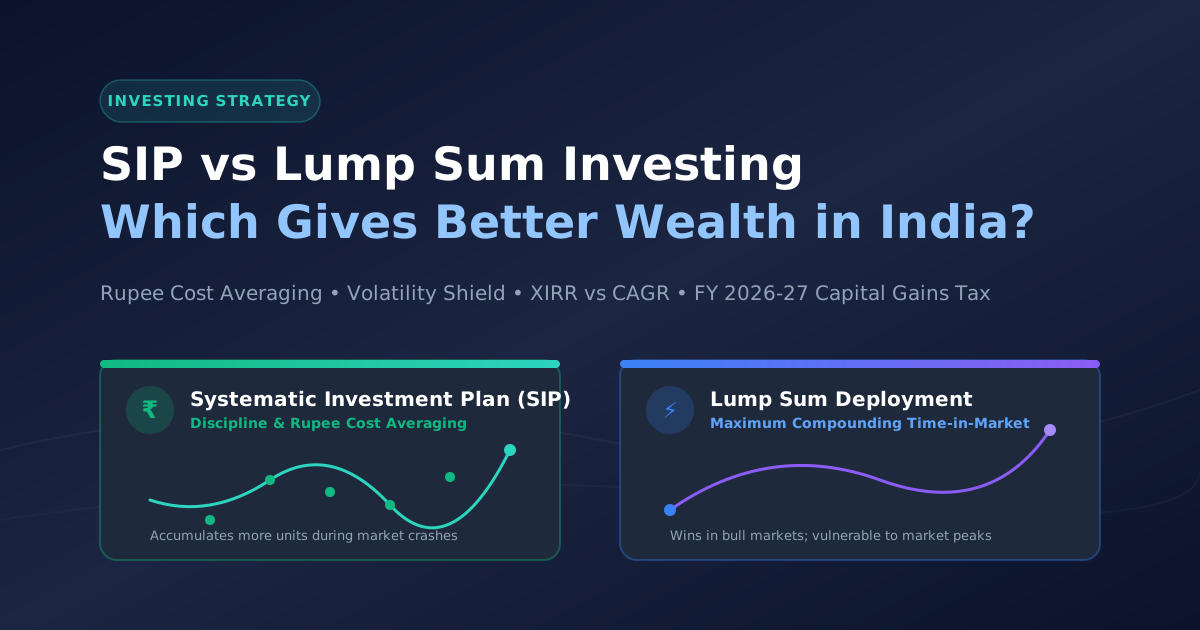
Systematic Investment Plan (SIP) is a recurring, automated mechanism where a predetermined sum (such as ₹10,000 or ₹25,000) is debited from your bank account on a chosen date every month and deployed into the chosen scheme. Rather than guessing whether the Nifty 50 is fairly valued or overstretched, an SIP enforces mechanical discipline. You purchase fewer units when market valuations are high and automatically accumulate significantly more units when markets crash.
In economic academia, the debate between lump sum and dollar-cost averaging (or rupee cost averaging in India) is well documented. Historically, diversified stock markets trend upward over long multi-decade horizons. Therefore, on purely statistical grounds, lump sum investing outperforms systematic averaging approximately 66% of the time across global rolling 10-year windows, simply because money spends more time in the market. However, human beings do not experience wealth creation inside sterile statistical models—they experience it with emotional volatility, loss aversion, and unpredictable personal cash flows.
2. How Rupee Cost Averaging (RCA) Actually Works
Rupee Cost Averaging is the mathematical engine underpinning the Systematic Investment Plan. The mathematical premise is remarkably elegant: because your monthly financial contribution remains constant in rupee terms, the number of fund units you purchase varies inversely with the prevailing market price.
Units Allotted = Monthly SIP Amount / Allotment Date NAV
Consider what happens during a severe correction. In an emotional market sell-off, unseasoned retail investors panic and stop their investments. In an automated SIP, that exact crash triggers a massive unit accumulation windfall. When the NAV plummets from ₹100 to ₹50, your fixed monthly installment of ₹10,000 purchases 200 units instead of 100 units.
When the market eventually recovers to its initial ₹100 baseline, your newly acquired 200 units double in value to ₹20,000, while your average acquisition cost across all months is pushed far below the starting market price. Rupee Cost Averaging ensures that you do not require a market to reach new all-time highs to turn a healthy profit—you merely need it to bounce back from its lows.
3. Head-to-Head Simulation: ₹1.2 Lakh in 3 Market Scenarios
To demystify how SIP compares to Lump Sum under real-world conditions, let us trace an exact empirical experiment. We take an investor with ₹1,20,000 to invest across a 12-month period starting at Month 1 with an initial fund NAV of ₹100.
Investor A (Lump Sum) invests the full ₹1,20,000 on Day 1 at NAV ₹100, receiving exactly 1,200.00 units.
Investor B (SIP) deploys ₹10,000 on the 1st of every month for 12 consecutive months. Let us track their outcomes across three real-world market trajectories.

Scenario A: High Volatility / V-Shaped Market
In this scenario, the market experiences severe turmoil. The NAV begins at ₹100, tumbles steadily down to ₹70 by Month 6, and rebounds aggressively back to ₹105 by Month 12.
| Month | NAV (₹) | SIP Outlay | Units Bought | Cumulative Units |
|---|---|---|---|---|
| Month 1 | ₹100 | ₹10,000 | 100.00 | 100.00 |
| Month 2 | ₹92 | ₹10,000 | 108.70 | 208.70 |
| Month 3 | ₹84 | ₹10,000 | 119.05 | 327.75 |
| Month 4 | ₹76 | ₹10,000 | 131.58 | 459.33 |
| Month 5 | ₹72 | ₹10,000 | 138.89 | 598.22 |
| Month 6 | ₹70 | ₹10,000 | 142.86 | 741.08 |
| Month 7 | ₹75 | ₹10,000 | 133.33 | 874.41 |
| Month 8 | ₹82 | ₹10,000 | 121.95 | 996.36 |
| Month 9 | ₹90 | ₹10,000 | 111.11 | 1,107.47 |
| Month 10 | ₹96 | ₹10,000 | 104.17 | 1,211.64 |
| Month 11 | ₹102 | ₹10,000 | 98.04 | 1,309.68 |
| Month 12 | ₹105 | ₹10,000 | 95.24 | 1,404.92 |
The Final Result at Month 12 (NAV ₹105):
- Lump Sum Portfolio: 1,200 units × ₹105 = ₹1,26,000 (Absolute Gain: +₹6,000 or +5.0%).
- SIP Portfolio: 1,404.92 units × ₹105 = ₹1,47,517 (Absolute Gain: +₹27,517 or +22.93%).
Notice the breathtaking difference. The market only gained 5% overall from Month 1 to Month 12. Yet the SIP investor generated an astonishing 22.93% return. Why? Because during Months 4 through 8, while headlines screamed gloom, the SIP accumulated hundreds of deeply discounted units at NAVs between ₹70 and ₹82.
Scenario B: Unrelenting Bull Market
Suppose the economy experiences an explosive liquidity surge. The NAV begins at ₹100 and marches relentlessly upward every month, closing at ₹145 by Month 12.
- Lump Sum Portfolio: 1,200 units × ₹145 = ₹1,74,000 (Gain: +₹54,000 or +45.0%).
- SIP Portfolio: Because the investor buys at ₹100, ₹104, ₹108... all the way to ₹145, their average buying NAV is approximately ₹121.50, totaling 987.65 units. At ₹145, portfolio value is ₹1,43,210 (Gain: +₹23,210 or +19.34%).
In a one-way bull market, Lump Sum crushes SIP because every single rupee started working at the rock-bottom valuation on Day 1. In an SIP, your remaining cash sat in a low-interest bank account while asset prices escalated.
Scenario C: Severe Secular Bear Market
Suppose a macro crisis triggers an extended downturn. The NAV starts at ₹100 and finishes at ₹65 at year-end.
- Lump Sum Portfolio: 1,200 units × ₹65 = ₹78,000 (Crushing loss of -₹42,000 or -35.0%).
- SIP Portfolio: The investor buys all the way down, finishing with an average NAV of approximately ₹81.50 and total portfolio value of ₹95,700 (Loss limited to -₹24,300 or -20.25%).
While neither investor avoided a loss, the SIP cut the drawdown by nearly half. More importantly, when the market inevitably turns, the SIP investor enters the subsequent bull cycle holding significantly more accumulated units.
4. Calculating Yield: Why CAGR Fails for SIP and You Need XIRR
One of the most frequent errors among Indian retail investors is using CAGR (Compound Annual Growth Rate) to evaluate their mutual fund SIP returns. Understanding why this produces entirely erroneous figures is crucial for portfolio auditing.
CAGR is designed exclusively for single point-to-point investments. The standard mathematical formula is:
If you invest ₹1,00,000 lump sum and it grows to ₹2,00,000 after 5 years, the CAGR formula applies cleanly because that entire ₹1,00,000 remained invested for all 5 years (n = 5).
Now consider a 5-year monthly SIP where you contributed ₹5,000 every month. Your first installment was invested for 60 months. But your 12th installment was invested for only 48 months. Your 36th installment was invested for only 24 months. And your 60th installment was invested for just 30 days!
If you simply sum your total invested capital (₹3,00,000) and compare it against your terminal corpus using CAGR, you are treating money invested last week as though it had been compounding for half a decade. This artificially suppresses your reported return rate.
To accurately gauge the performance of multiple, irregular, or recurring cash flows, financial mathematics uses XIRR (Extended Internal Rate of Return). XIRR calculates the exact discount rate that equates the net present value (NPV) of all staggered cash outflows to the present value of the terminal portfolio:
Where Ct represents each cash flow, dt is the specific transaction date, and r is the internal rate of return (XIRR). In Microsoft Excel or Google Sheets, you can calculate this instantly using the formula =XIRR(values_range, dates_range). Whenever reviewing your mutual fund account statements from CAMS, KFintech, Zerodha Coin, or Groww, always look for the XIRR metric, not absolute return or CAGR.
5. FY 2026-27 Capital Gains Tax Rules: The 12-Month FIFO Trap
Tax efficiency can make or break your net investment returns. The Union Budget introduced revised capital gains tax frameworks for Indian mutual funds that apply strictly across FY 2026-27 (AY 2027-28).
For equity-oriented mutual funds (schemes allocating 65% or more into domestic equities):
- Long-Term Capital Gains (LTCG): Applies when units are held for more than 12 months. Tax-free exemption threshold is ₹1.25 Lakh per financial year (hiked from the previous ₹1 Lakh). Any LTCG gains above ₹1.25 Lakh are taxed at 12.5% (plus applicable 4% Health and Education Cess). Indexation benefit is not available on equity funds.
- Short-Term Capital Gains (STCG): Applies when units are held for 12 months or less. Taxed at a flat rate of 20% (increased from the previous 15%) under Section 111A.
⚠️ The 12-Month First-In-First-Out (FIFO) Tax Trap on SIPs
Many investors erroneously believe that if they start an SIP on January 1, 2025, and redeem their entire fund folio in March 2026 (after 15 months), the entire corpus qualifies for the lower 12.5% LTCG rate with the ₹1.25 Lakh tax shield. This is completely incorrect under Indian tax law.
Under Section 45 and Section 112A, the Income Tax Department evaluates unit redemptions on a First-In-First-Out (FIFO) basis. Each monthly SIP installment represents an independent investment with its own distinct purchase date and holding period.
Let us illustrate this with a practical breakdown. Suppose you ran a monthly SIP of ₹20,000 from January 2025 to December 2025 (12 installments), and you decide to redeem your entire portfolio in March 2026 (Month 15):
| SIP Installment Date | Redemption Date | Holding Period | Applicable Tax Classification |
|---|---|---|---|
| January 2025 | March 2026 | 14 months | LTCG (12.5% beyond ₹1.25L) |
| February 2025 | March 2026 | 13 months | LTCG (12.5% beyond ₹1.25L) |
| March 2025 | March 2026 | 12 months | LTCG (12.5% beyond ₹1.25L) |
| April 2025 to Dec 2025 | March 2026 | 3 to 11 months | STCG (Flat 20% on all gains!) |
As you can see, 9 out of your 12 installments are penalized with the higher 20% Short-Term Capital Gains tax! To harvest the maximum tax-free benefit of the ₹1.25 Lakh exemption, you should pause your SIP and redeem units in tranches across subsequent financial years as each installment completes its 365-day aging threshold.
6. Investor Psychology: All-Time Highs and Market Timing Fallacies
When financial analysts debate lump sum vs SIP using pure spreadsheet math, they overlook human psychology. Standard behavioral economics reveals two massive psychological roadblocks that cause retail investors to underperform benchmark indices:
- All-Time High Paralysis: When the Nifty crosses landmark thresholds (such as 22,000, 25,000, or 28,000), investors sitting on cash refuse to deploy lump sums, fearing an imminent crash. They leave money in 3.5% savings accounts for months or years, missing out on massive compounding.
- Post-Crash Panic (Loss Aversion): Kahneman and Tversky proved that the emotional pain of losing ₹1,00,000 is twice as acute as the joy of gaining ₹1,00,000. If an investor deploys a ₹5,00,000 lump sum and watches it drop to ₹4,25,000 within three weeks, their instinct is to stop investing or panic-sell at the exact market trough.
The greatest value proposition of an SIP is not mathematical optimization—it is behavioral insulation. By automating the deduction directly from your salary account on the 1st or 5th of each month, an SIP eliminates emotion. You stop checking daily market closing levels on financial news channels, because you know a market slump is simply buying cheaper equity units for your retirement.
7. Advanced Strategies: The 10% Step-Up SIP and STP Workflows
What if you don't have to choose strictly between a static SIP and a high-risk lump sum? Modern Indian mutual fund platforms allow you to execute two sophisticated hybrid strategies:
The Step-Up SIP (Top-Up SIP)
A static SIP of ₹15,000/month for 20 years at a 12% annualized return yields a total corpus of approximately ₹1.50 Crores on an invested principal of ₹36 Lakhs.
However, your salary will not remain flat for 20 years. If your annual appraisal increases your CTC by 8% to 12%, keeping your SIP contribution constant means you are investing a steadily shrinking percentage of your income.
By setting up a 10% Annual Step-Up SIP, your contribution increases automatically: ₹15,000 in Year 1, ₹16,500 in Year 2, ₹18,150 in Year 3, and so on. Over the same 20-year period, your accumulated wealth explodes to ₹2.88 Crores on an invested capital of ₹1.03 Crores. You nearly double your terminal retirement wealth with zero added mental friction!
The Systematic Transfer Plan (STP) for Large Windfalls
What should you do when you receive an irregular lump sum—such as a ₹5,00,000 joining bonus, proceeds from an ESOP liquidation, or an inheritance?
Dumping ₹5 Lakh into a midcap fund in a single day carries elevated timing risk. Letting it sit in a bank savings account earns barely 3% after tax. The professional solution is an STP within the same mutual fund house (AMC):
- Deposit the ₹5 Lakh lump sum into a Liquid Fund, Ultra Short Duration Fund, or Arbitrage Fund. This earns a stable 6.5% to 7.0% annualized return with negligible capital volatility.
- Instruct the AMC to execute a weekly or monthly STP of ₹40,000 into your designated equity scheme over 12 months.
- Your unallocated capital earns competitive money-market yields while your equity exposure is systematically phased in through Rupee Cost Averaging.
8. 5 Costly Mistakes Indian Mutual Fund Investors Make
1. Pausing or Stopping SIPs During Market Corrections
Stopping your SIP when headlines warn of an economic downturn is the single most destructive habit in investing. Crashes are when your monthly installment acquires units at bargain-basement prices. Stopping SIPs during bears turns your portfolio into a buyer at the top and an observer at the bottom.
2. Running Multiple SIPs on the Same Day of the Month
Many investors run 5 separate SIPs all debited on the 10th of every month. While simple to track, staggering your dates (e.g., Fund A on the 5th, Fund B on the 12th, Fund C on the 20th, Fund D on the 28th) achieves intra-month rupee cost averaging across varying derivatives expiry settlement cycles.
3. Over-Diversifying Across Too Many Mutual Funds
Investing ₹15,000/month split across 8 different flexi-cap and large-cap funds results in severe portfolio overlap. An investor holding 4 diversified schemes often owns 250 underlying stocks, virtually mimicking the Nifty 50 while paying multiple fund expense ratios. 3 to 4 well-chosen funds are plenty.
4. Choosing Dividend Payout Over Growth Option
Under current Indian tax laws, dividends distributed by mutual funds (IDCW option) are added directly to your taxable income and taxed at your marginal slab rate (up to 35.88% with surcharge). Always choose the Growth Option so profits compound tax-free within the fund until redemption.
5. Ignoring Regular vs Direct Plan Expense Ratios
A Regular mutual fund plan pays an ongoing 0.5% to 1.2% annual distributor commission out of your NAV. On a 25-year compounding horizon, choosing Direct Plans (available free on official AMC portals, Zerodha Coin, Groww, etc.) saves ₹25 Lakh to ₹50 Lakh in cumulative distributor commissions!
9. Frequently Asked Questions (FAQ)
Is SIP safer than Lump Sum investing in equity mutual funds?
Yes. While both invest in the same underlying equities, SIP eliminates the catastrophic risk of investing 100% of your capital right before a major 20% to 30% market correction. Staggered investing guarantees that market drops work in your favor by acquiring cheaper units.
Why is XIRR used instead of CAGR to calculate SIP returns?
CAGR assumes a single lump sum compounding over a fixed period. Because an SIP involves multiple cash inflows happening on different dates at different NAV prices, Extended Internal Rate of Return (XIRR) is required to calculate the exact annualized yield on each staggered installment.
How are SIP withdrawals taxed under the latest Indian capital gains rules?
Under FY 2026-27 rules, Long-Term Capital Gains (held >12 months) are taxed at 12.5% on gains exceeding ₹1.25 Lakh per financial year. Short-Term Capital Gains (held <=12 months) are taxed at flat 20%. Under First-In-First-Out (FIFO), each SIP installment is tracked independently against its own 365-day holding clock.
What should I do if I receive a large annual bonus or inheritance?
Set up a Systematic Transfer Plan (STP). Park the lump sum in an ultra-low-risk Liquid or Arbitrage Fund earning 6.5%-7.0%, and schedule an automated weekly or monthly transfer into your target equity fund over 6 to 12 months. This mitigates market timing risk while preventing cash drag.
Does a Step-Up SIP beat a traditional fixed SIP?
Yes, substantially. Increasing your SIP contribution by 10% annually in tandem with your salary appraisals can nearly double your final retirement corpus over 15 to 20 years compared to maintaining a flat monthly contribution.
10. Summary & Decision Framework
Choosing between SIP and Lump Sum is not a dogmatic financial doctrine—it is a matter of capital source and current market valuation:
- If you earn a regular monthly salary: Put 100% of your monthly investable surplus into an automated SIP scheduled 1 to 2 days after payday. Never hoard cash waiting for a "dip" that may not arrive for months.
- If you receive a lump sum and markets are at elevated valuations: Stagger the capital via an STP over 6 to 12 months from a Liquid Fund into an Equity Fund.
- If the market experiences a sharp 15% to 20% correction: Deploy available cash in lump-sum tranches alongside your existing ongoing SIPs.
- Always opt for Direct, Growth plans to keep 100% of your compounding gains away from broker commissions and annual dividend tax slabs.
Ready to simulate your future wealth? Run custom scenarios on our free SIP Calculator or model loan payoffs on the EMI Calculator to optimize your personal balance sheet.